See clusters early
Hot spots are visible as they form.
Projects Systems & consultancy
Interactive maps and analytics that show public health teams where cases are occurring.
Overview
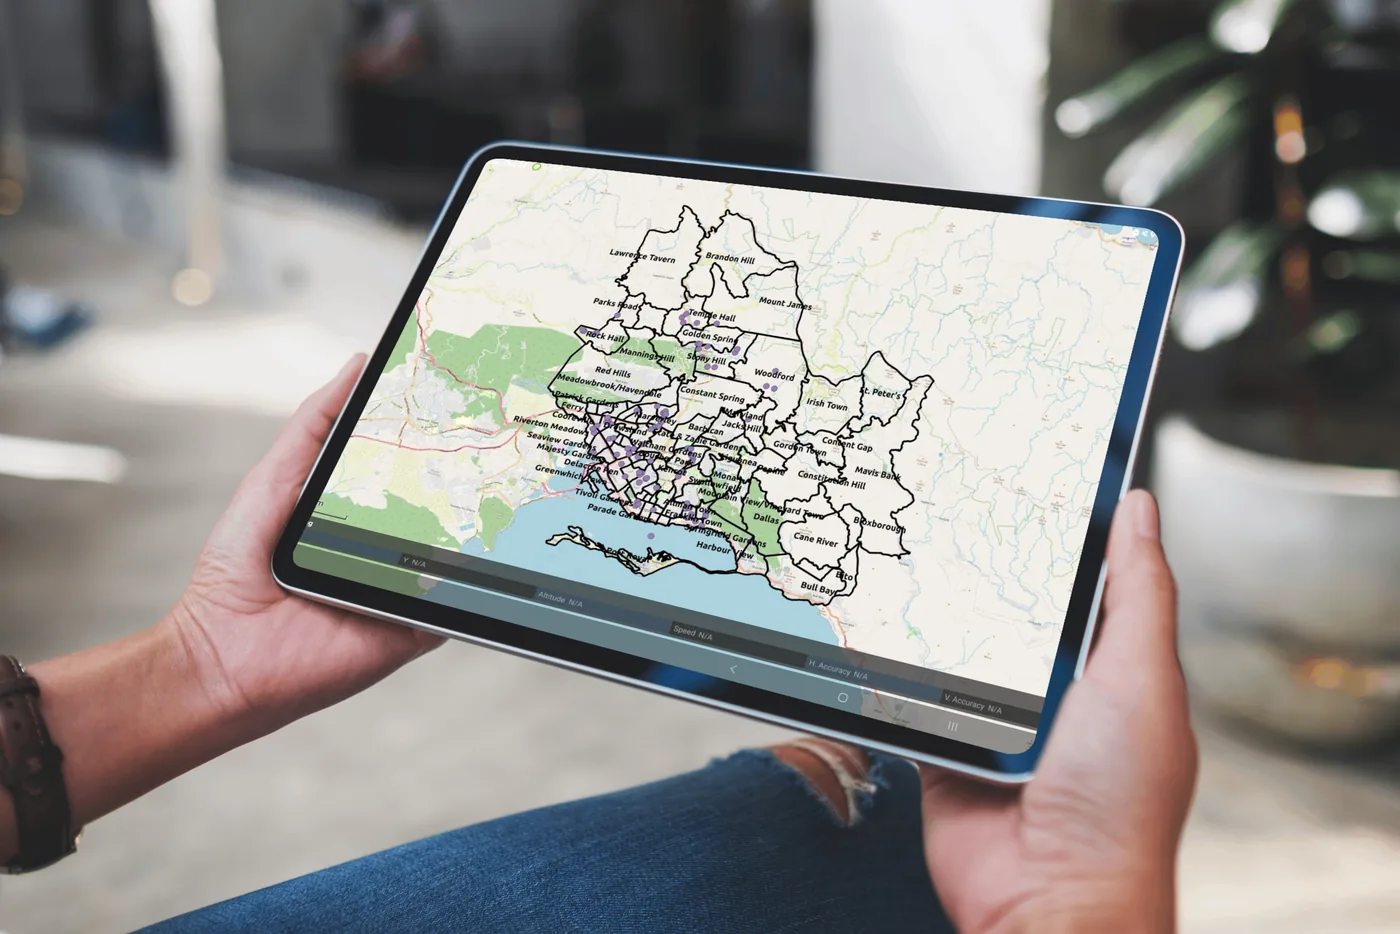
The Disease Mapping Dashboard brings case data onto an interactive map, so surveillance teams can see where cases are occurring, spot clusters and focus their response.
How it works
Case data is linked to communities and parishes.
Cases are mapped so geographic patterns and clusters stand out.
Dashboards summarise the picture for briefings and decision-makers.
Impact
Hot spots are visible as they form.
Resources go where cases are concentrated.
Maps and charts ready for briefings and reports.
More work
 Systems & consultancy
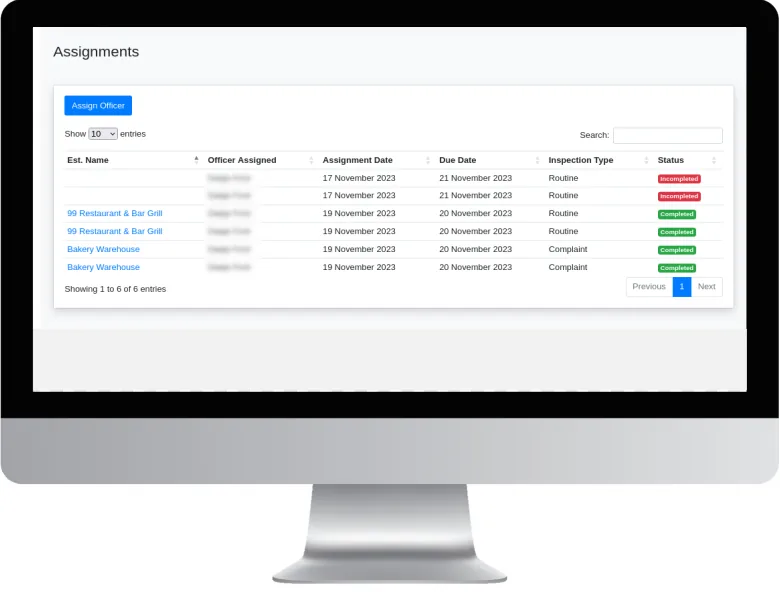
A GIS-based system for planning, recording and monitoring food establishment inspections.
View project Systems & consultancy
Bringing mapping and spatial analysis into the everyday work of a parish health department.
View project Research
Mapping which Aedes mosquito species occur across Kingston and St Andrew, and where.
View projectWhether you’re a public health agency, a university or a private enterprise, SynerGIS helps you turn data into action. We collaborate on research, build GIS systems and deliver solutions for Jamaica’s sustainable future.